XRD
X-ray diffraction: principles and material examples
Principle
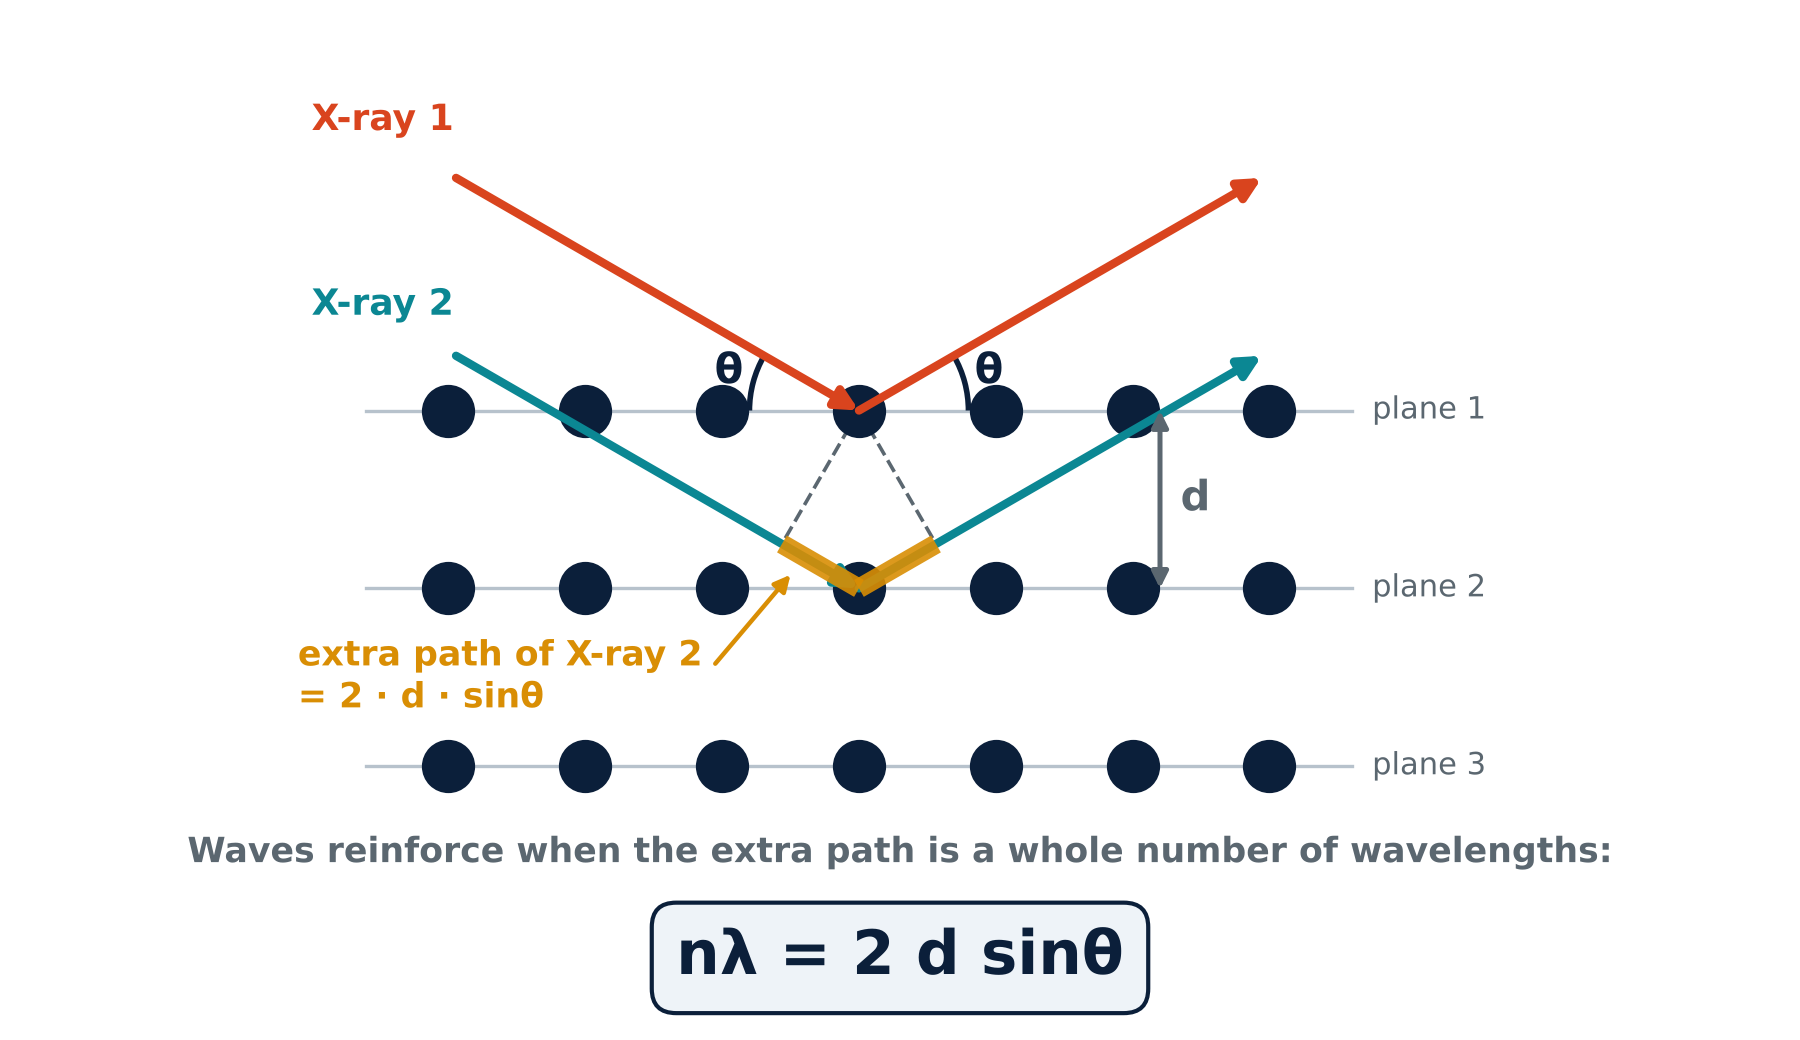
X-rays scatter from the atoms in a material. In a crystal, regularly spaced atomic planes produce constructive interference when Bragg’s law, nλ = 2d sinθ, is satisfied. The measured peak position is 2θ; half that angle is used to calculate the interplanar spacing d.
OutcomeIdentify crystalline phases and follow lattice-spacing changes. With suitable models and corrections, peak profiles and integrated scattering can also inform coherent domain size, strain, texture and crystallinity. The guide compares glasses, polymers, single crystals, phosphors, ceramics, metals, nanomaterials and glass-ceramics.
Principle reference: Yale · XRD principleEvery PDF page carries the “Varnakavi” watermark. Material patterns are simulated teaching examples, not experimental measurements.
Read the full XRD discussion
The big idea
Every solid is made of atoms. In some materials the atoms sit in neat, repeating rows, like soldiers on a parade ground. In others they are jumbled, like a crowd. X-ray diffraction (XRD) tells you which of these a material is, and, if it is ordered, which arrangement it has.
X-rays are used because their wavelength (about 0.154 nm for the common copper source) is close to the gap between neighbouring atoms. Waves bend and interfere when they meet objects about their own size, so rows of atoms act on X-rays like a very fine grating.
- Is it ordered? A crystal has long-range periodic order; a glass lacks it but retains local order.
- Which material is it? Each crystal structure gives its own fingerprint.
- How large are the coherent domains, and how strained? Peak analysis can probe crystallite size, strain and texture; suitable methods estimate crystallinity.
Why peaks appear: Bragg's law
Imagine the atoms as balls on stacked shelves. Each shelf bounces a little of the X-ray beam. The ray that reaches the second shelf travels a bit further than the one bounced from the first (the amber stretch in Figure 1). When that extra distance is exactly one wavelength, or two, or three, the bounced waves line up and reinforce; the detector sees a strong signal. At other angles the waves cancel.
nλ = 2 d sinθ
Here λ is the X-ray wavelength, d is the spacing between atomic planes, θ is the Bragg angle between the incident beam and those planes, and n is an integer. The plotted diffraction angle is 2θ, so halve a measured peak position before using the equation. For first order (n = 1), d = λ ÷ (2 sinθ).
The instrument
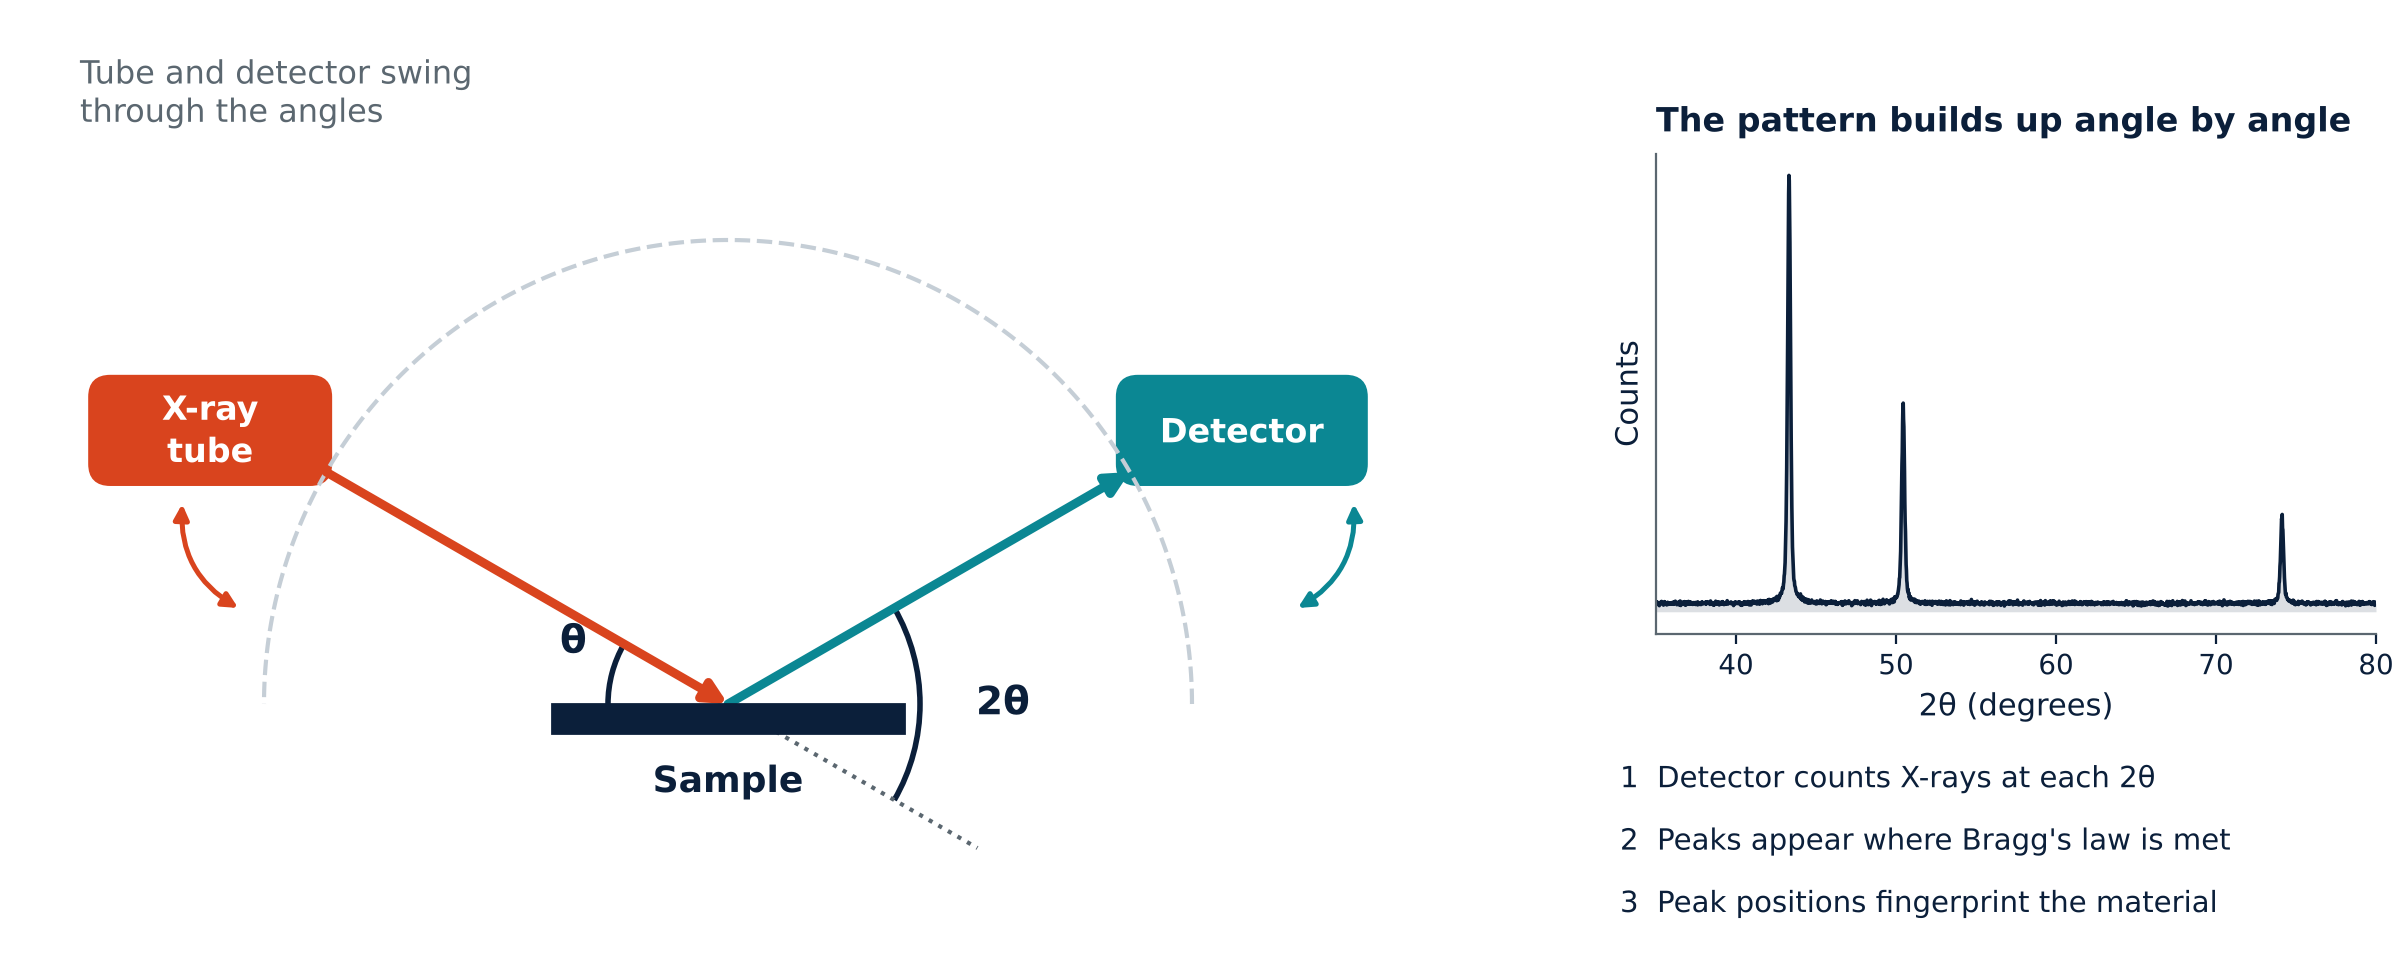
A diffractometer records diffracted intensity versus the angle 2θ between the incident and diffracted beams. The moving components depend on the geometry: in θ–θ instruments the tube and detector move around a stationary sample; in θ–2θ instruments the source can remain fixed while the sample and detector rotate. Powders, films, solid pieces and wafers need appropriate mounting and optics. XRD is often nondestructive, although beam-sensitive materials need care.
Three kinds of order, three pictures
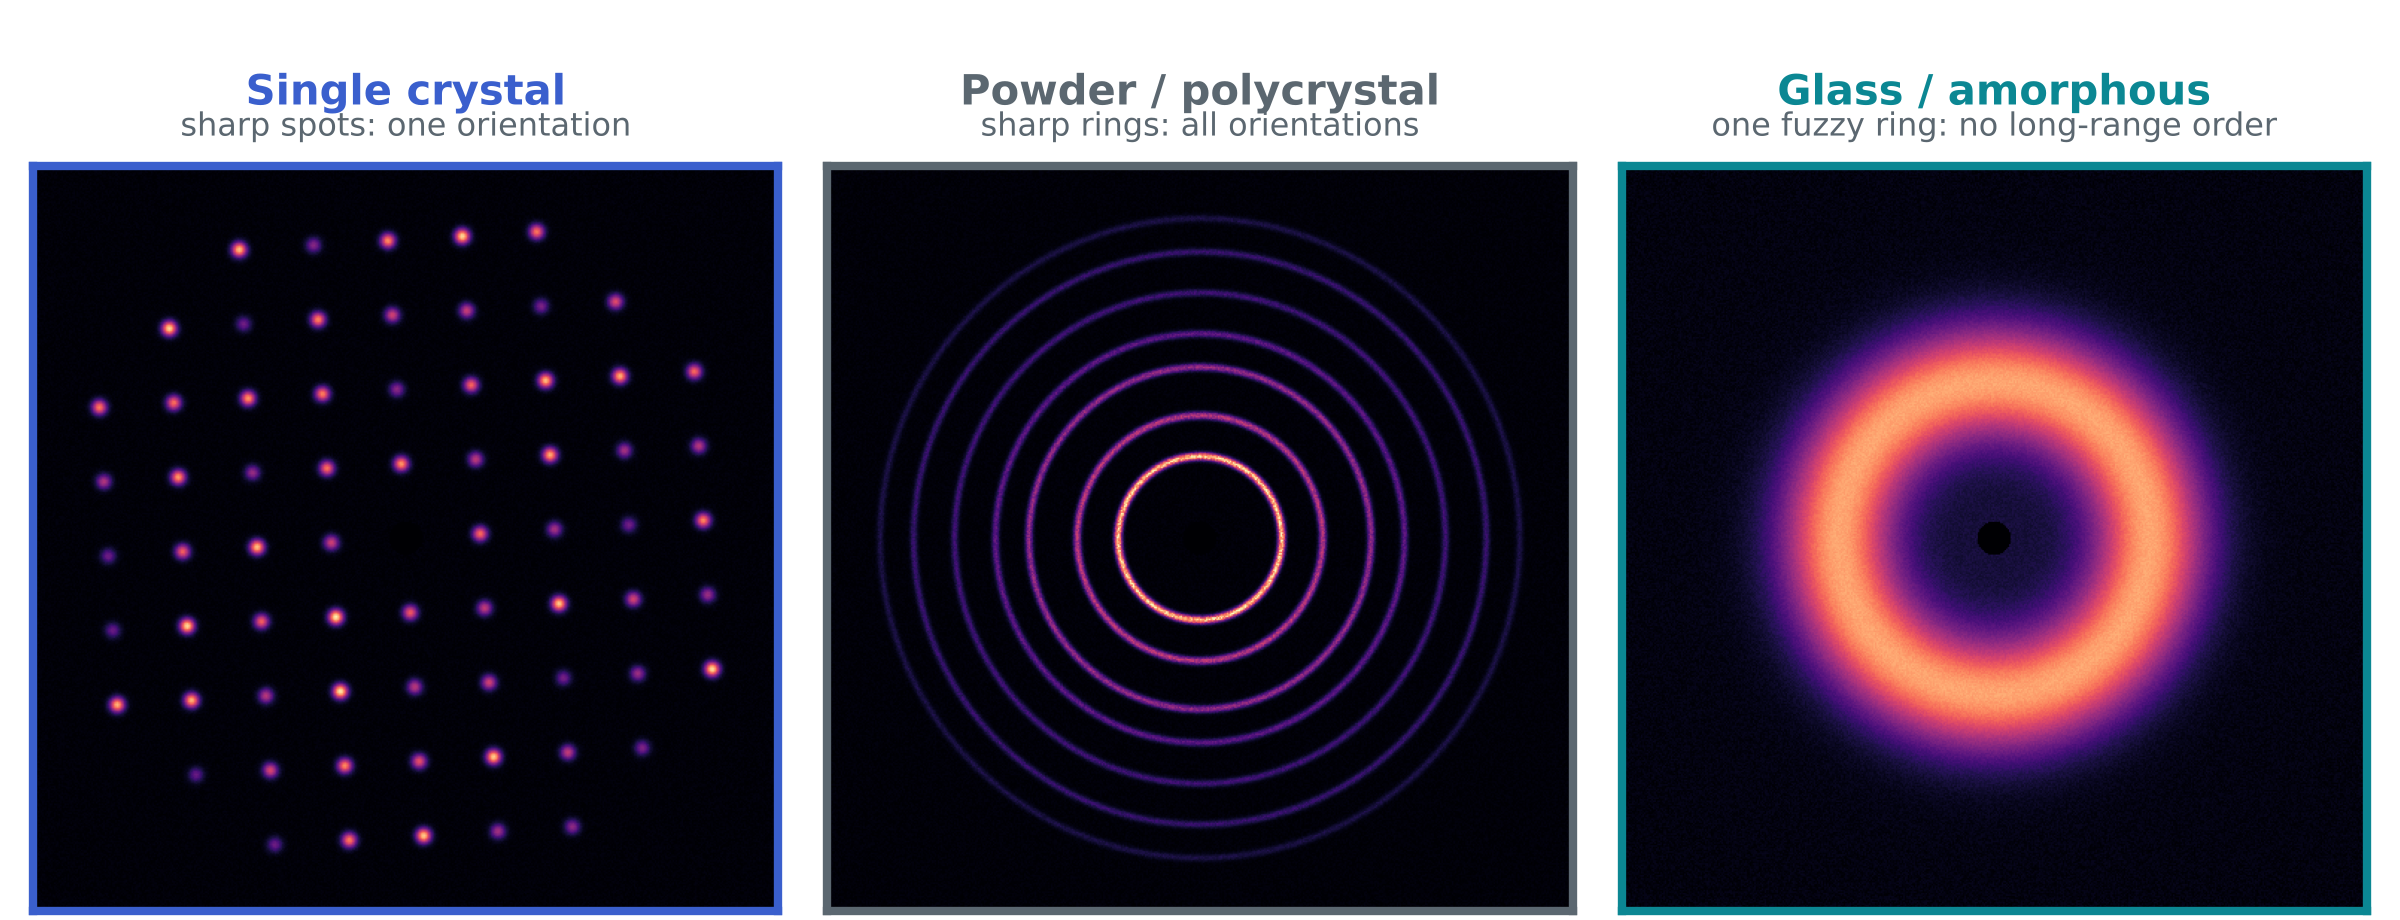
- Single crystal: a common lattice orientation gives discrete diffraction spots. The reflections captured depend on crystal orientation and measurement geometry.
- Powder or polycrystal: many randomly oriented crystallites produce rings. Texture or limited sampling can instead give arcs or spotty rings.
- Glass or amorphous: lack of long-range periodicity produces broad diffuse scattering, sometimes with more than one halo.
Azimuthal integration of an area-detector image gives intensity versus 2θ. Powder rings yield sharp peaks and amorphous scattering yields broad features. A single-crystal image samples only the reflections accessible in that orientation; it is not a complete powder pattern.
Reading a pattern: four clues
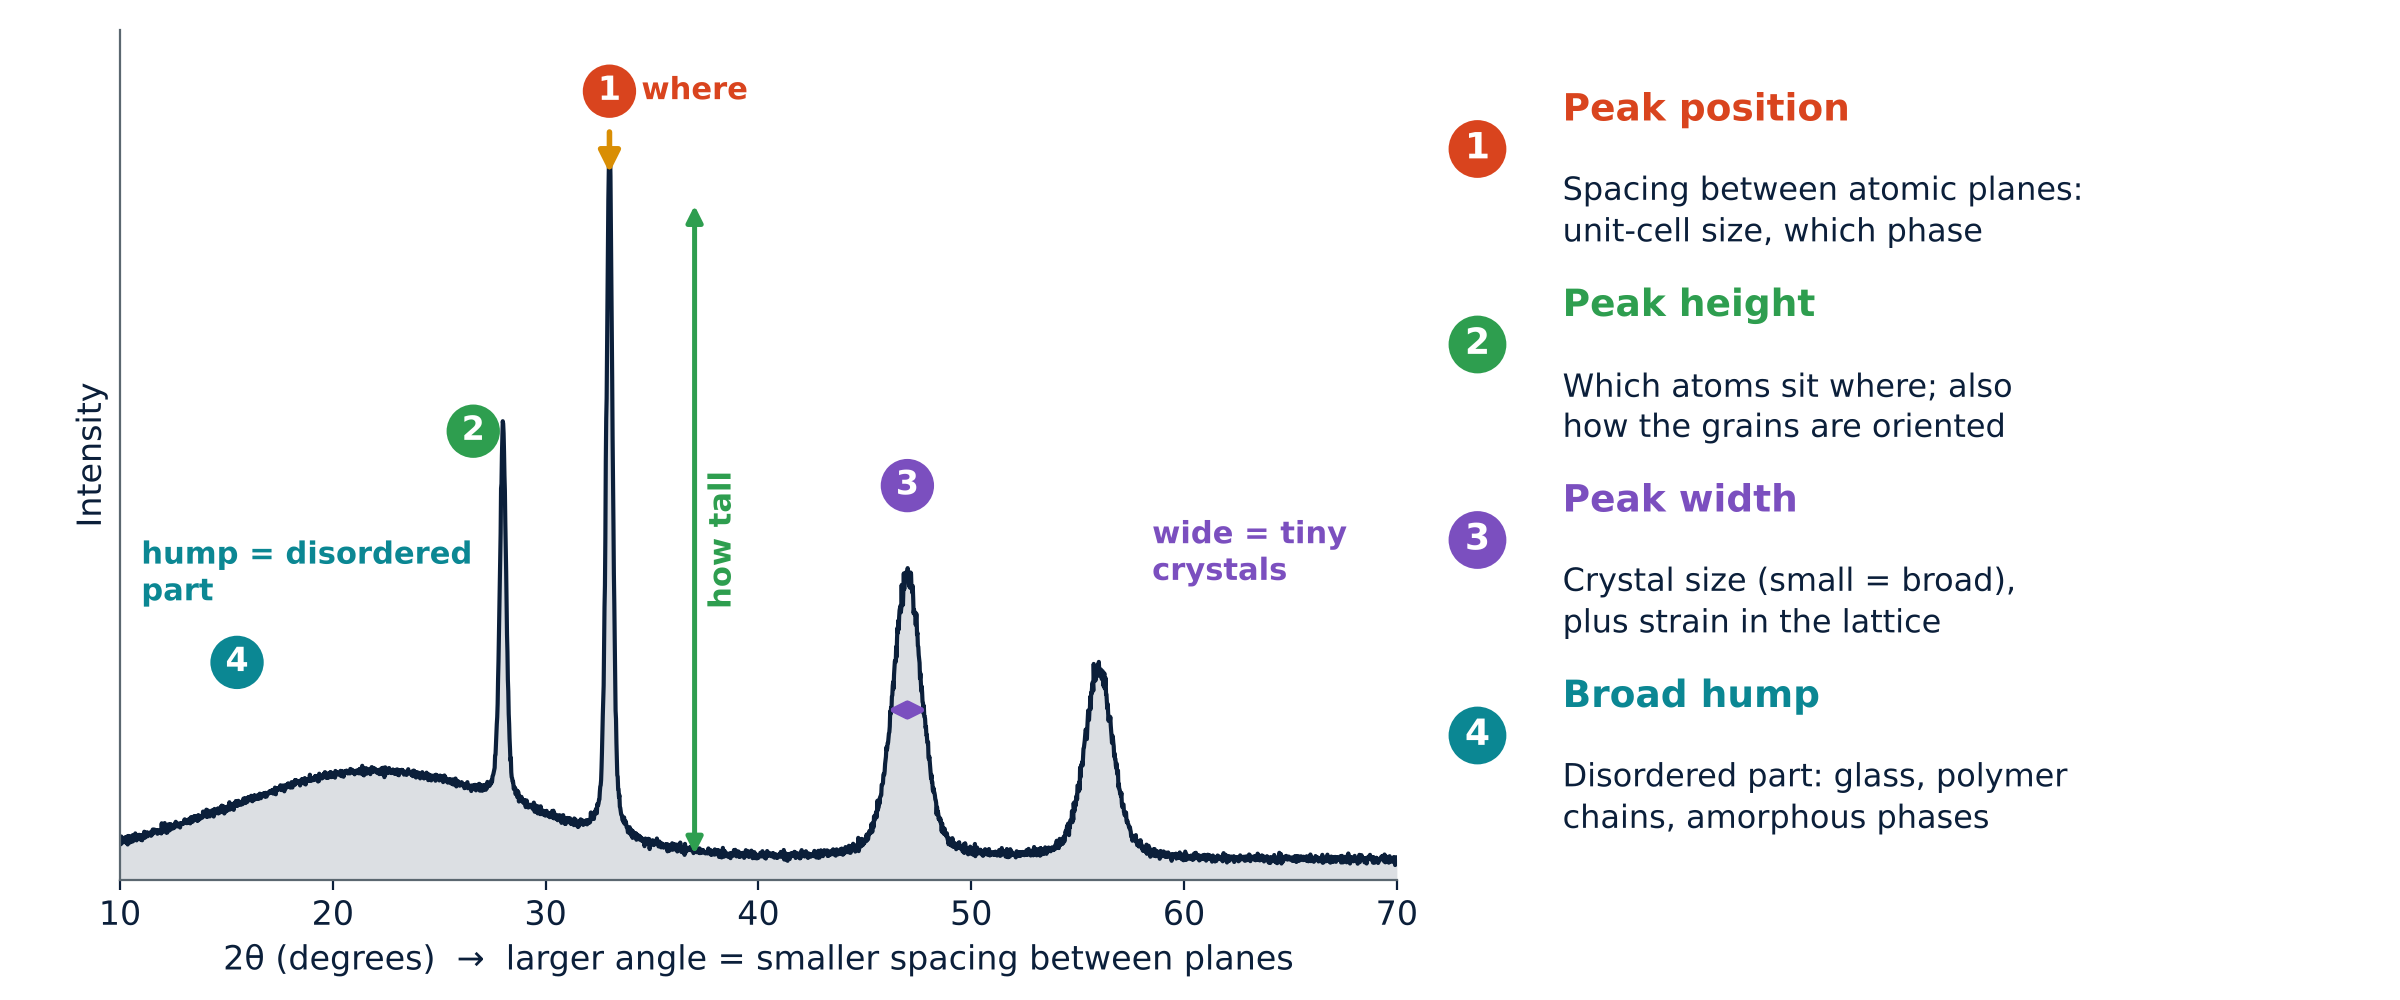
| Clue | What to look at | What it tells you |
|---|---|---|
| 1 Position | Where the peaks sit (angle 2θ) | Spacing between atomic planes, hence the size of the unit cell and which phase it is |
| 2 Height | How tall each peak is | Which atoms sit where, and how the grains are oriented |
| 3 Width | How broad each peak is | Coherent domain size and lattice strain, after instrumental correction |
| 4 Hump | A broad swell under or between peaks | The disordered part: glass, tangled polymer chains, amorphous phases |
A worked example: peaks that move
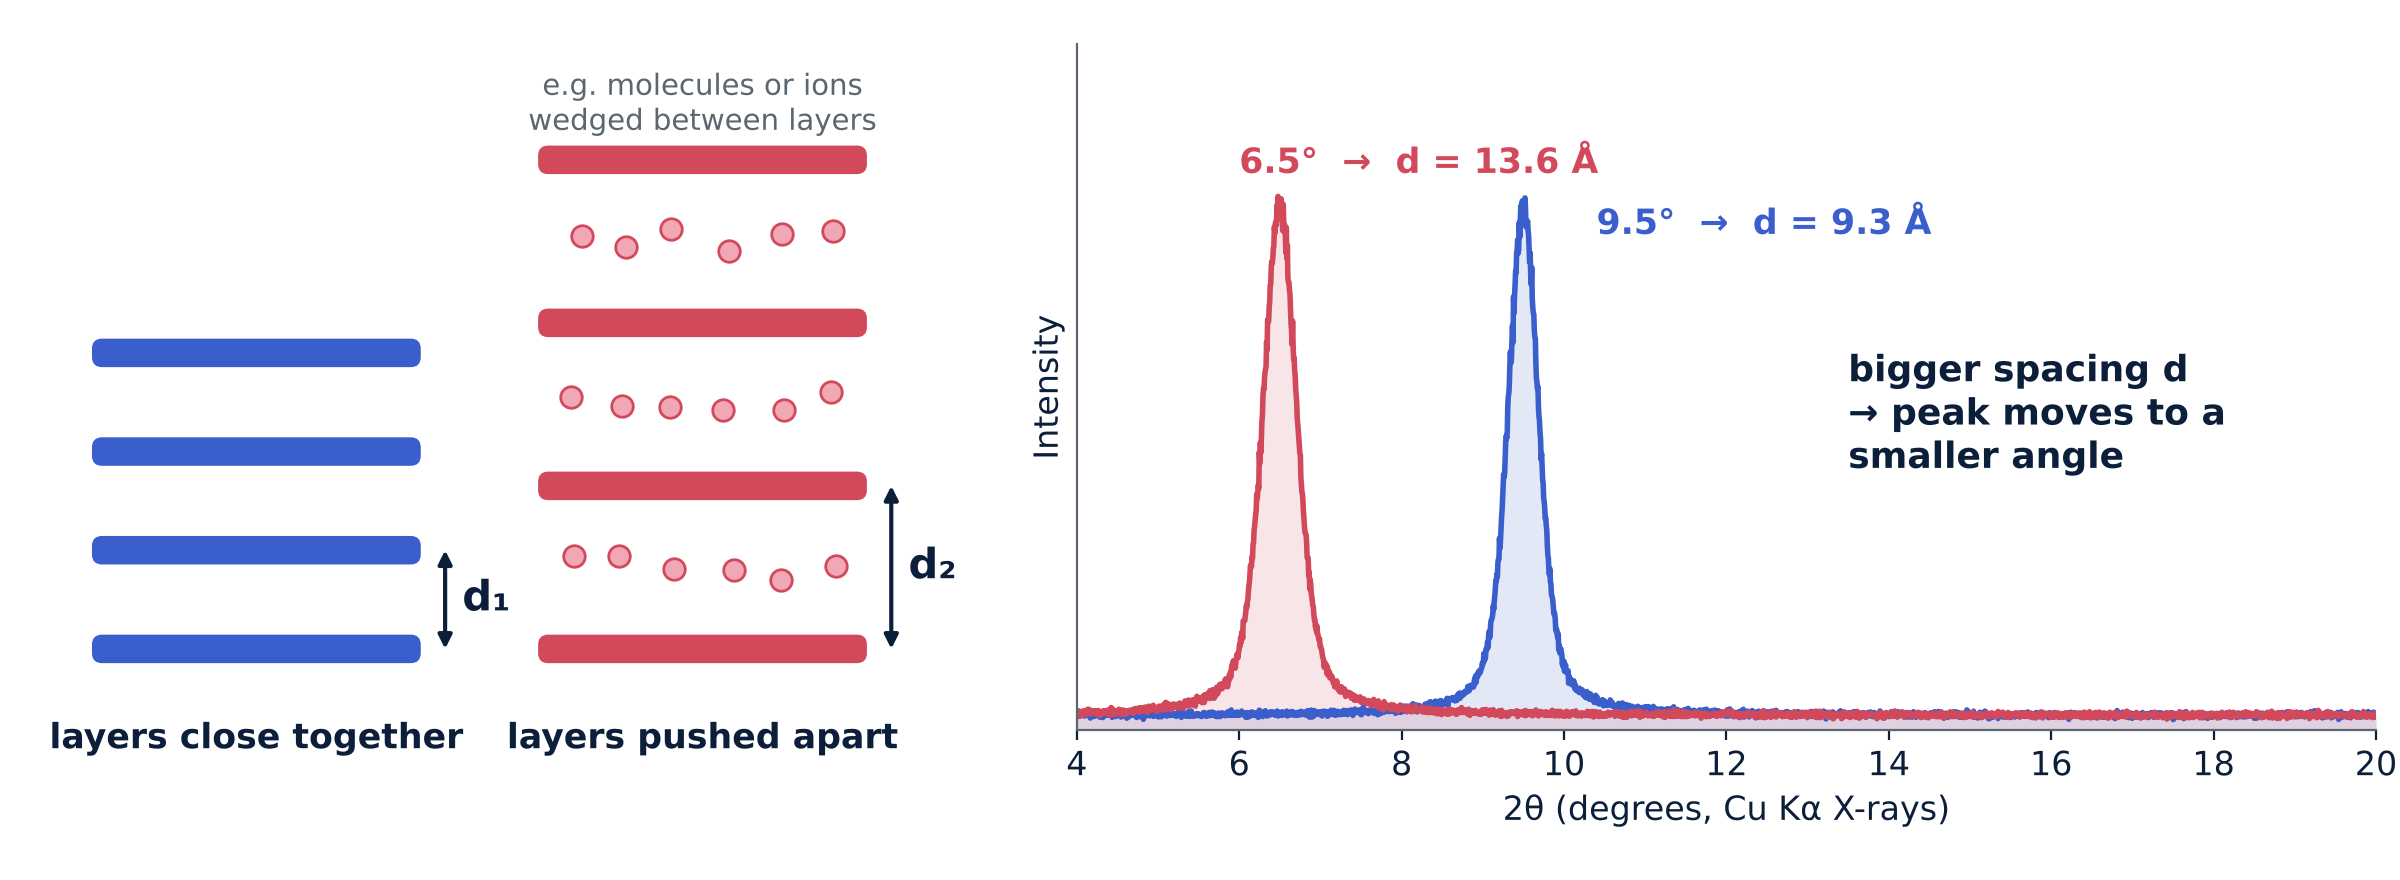
For first-order diffraction with λ = 1.54 Å, a peak at 2θ = 9.5° gives d ≈ 9.3 Å; at 2θ = 6.5°, d ≈ 13.6 Å. For the same indexed reflection, a shift to lower 2θ means a larger interplanar spacing. Intercalation or lattice expansion can cause this, but alignment, sample displacement and changes of phase or indexing must also be checked.
What XRD shows for each kind of material
All patterns in this document were simulated for teaching, using standard lattice sizes and peak positions where applicable. Peak heights and widths are illustrative.
Glass (amorphous)
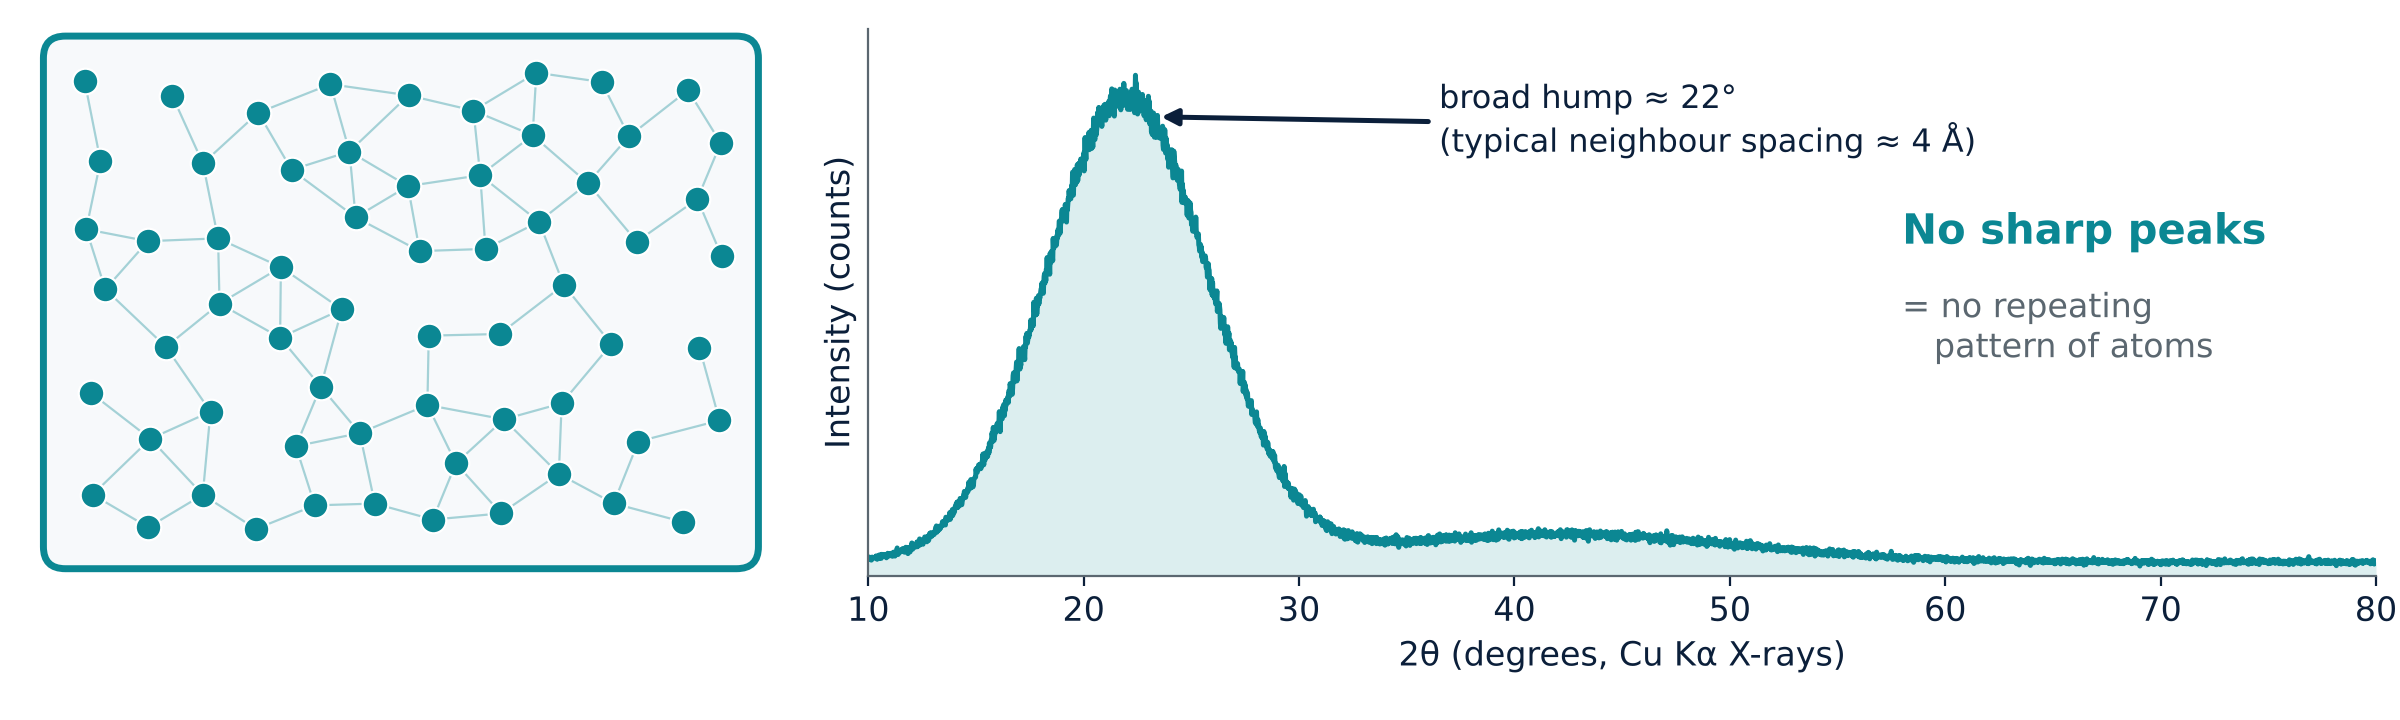
A glass lacks long-range periodic order but retains short- and intermediate-range correlations. It therefore shows broad diffuse features rather than a set of sharp Bragg peaks. Silica glass often has a broad feature near 22° with Cu Kα radiation. That feature is not a direct measurement of a nearest-neighbour bond length; total-scattering pair-distribution-function analysis is needed for real-space distances.
- What you see: broad diffuse scattering, with no resolved crystalline peaks in the illustrated scan.
- What it means: local atomic order remains, while long-range lattice periodicity is absent.
- What you use it for: assessing predominantly amorphous character. No visible peaks does not exclude crystalline material below the detection limit or very small crystallites.
Polymers
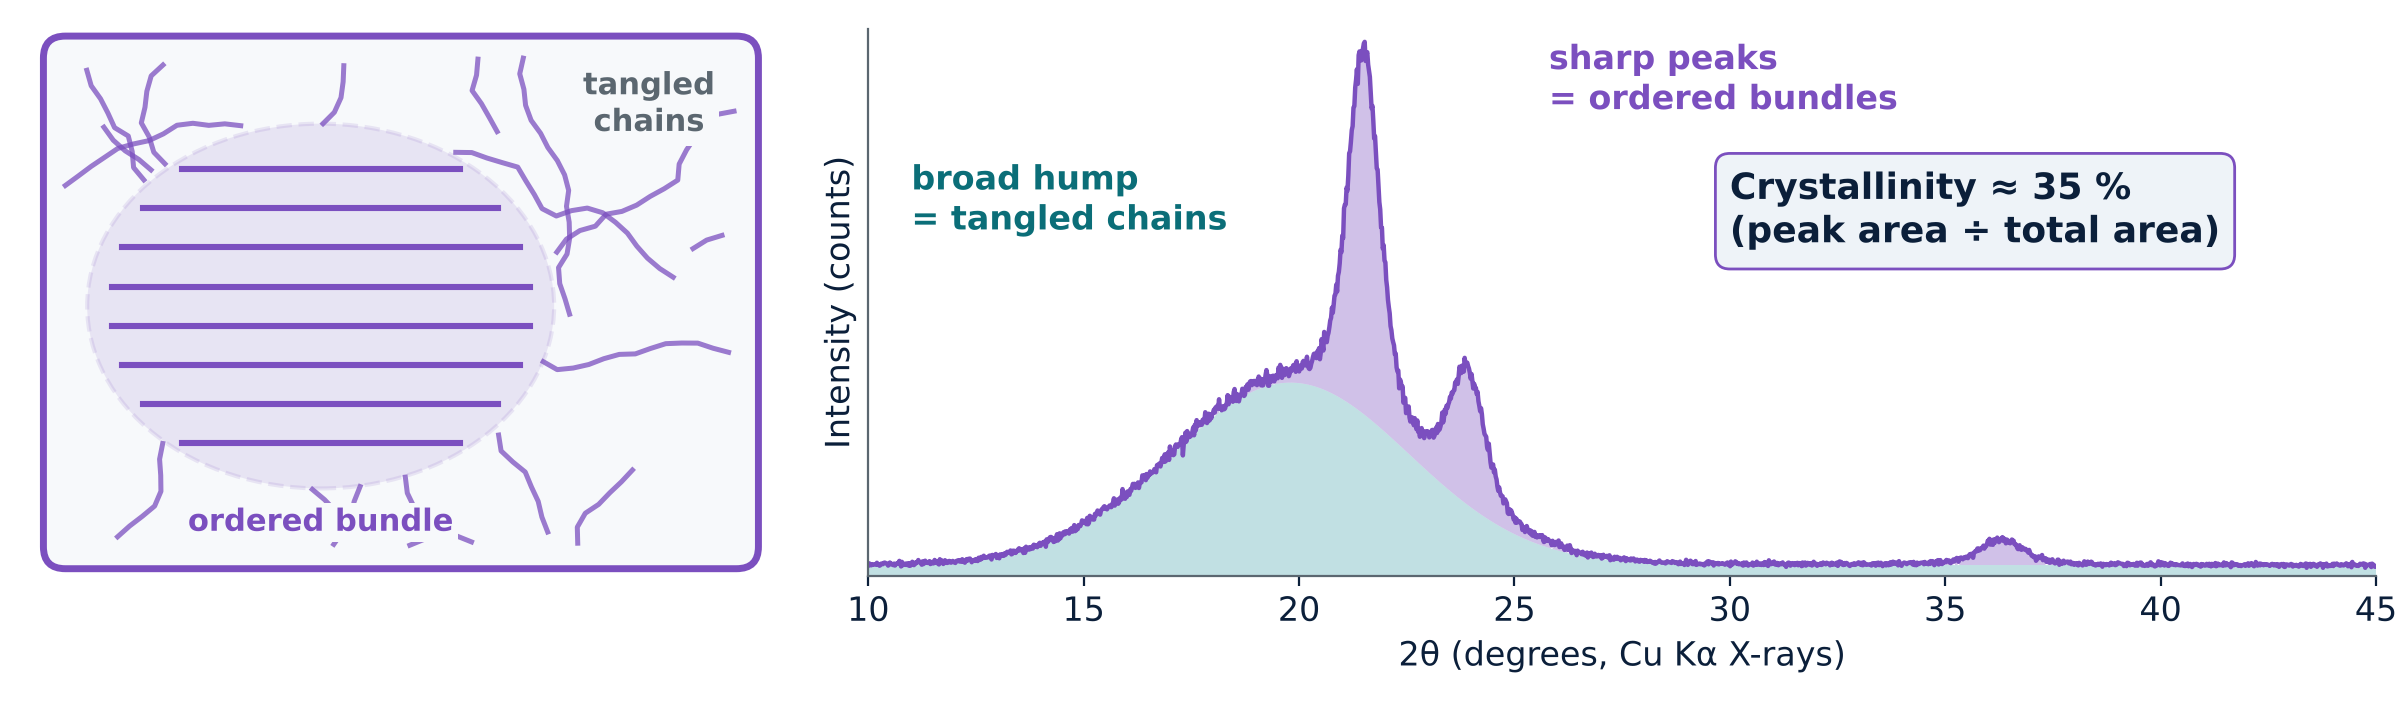
Polymers may be amorphous or semicrystalline. In a semicrystalline polymer, ordered chain regions give diffraction peaks on top of diffuse scattering from disordered regions. An area method estimates Xc (%) = Ac / At × 100, where Ac is the integrated crystalline scattering and At = Ac + Aa includes crystalline and amorphous scattering after background subtraction. Peak separation and baseline choice affect the result; it is a method-dependent estimate rather than a universal mass fraction. The simulated example illustrates about 35% crystallinity.
- What you see: sharp peaks on a broad hump.
- What you use it for: estimating percentage crystallinity and following how processing or ageing changes it.
Single crystals
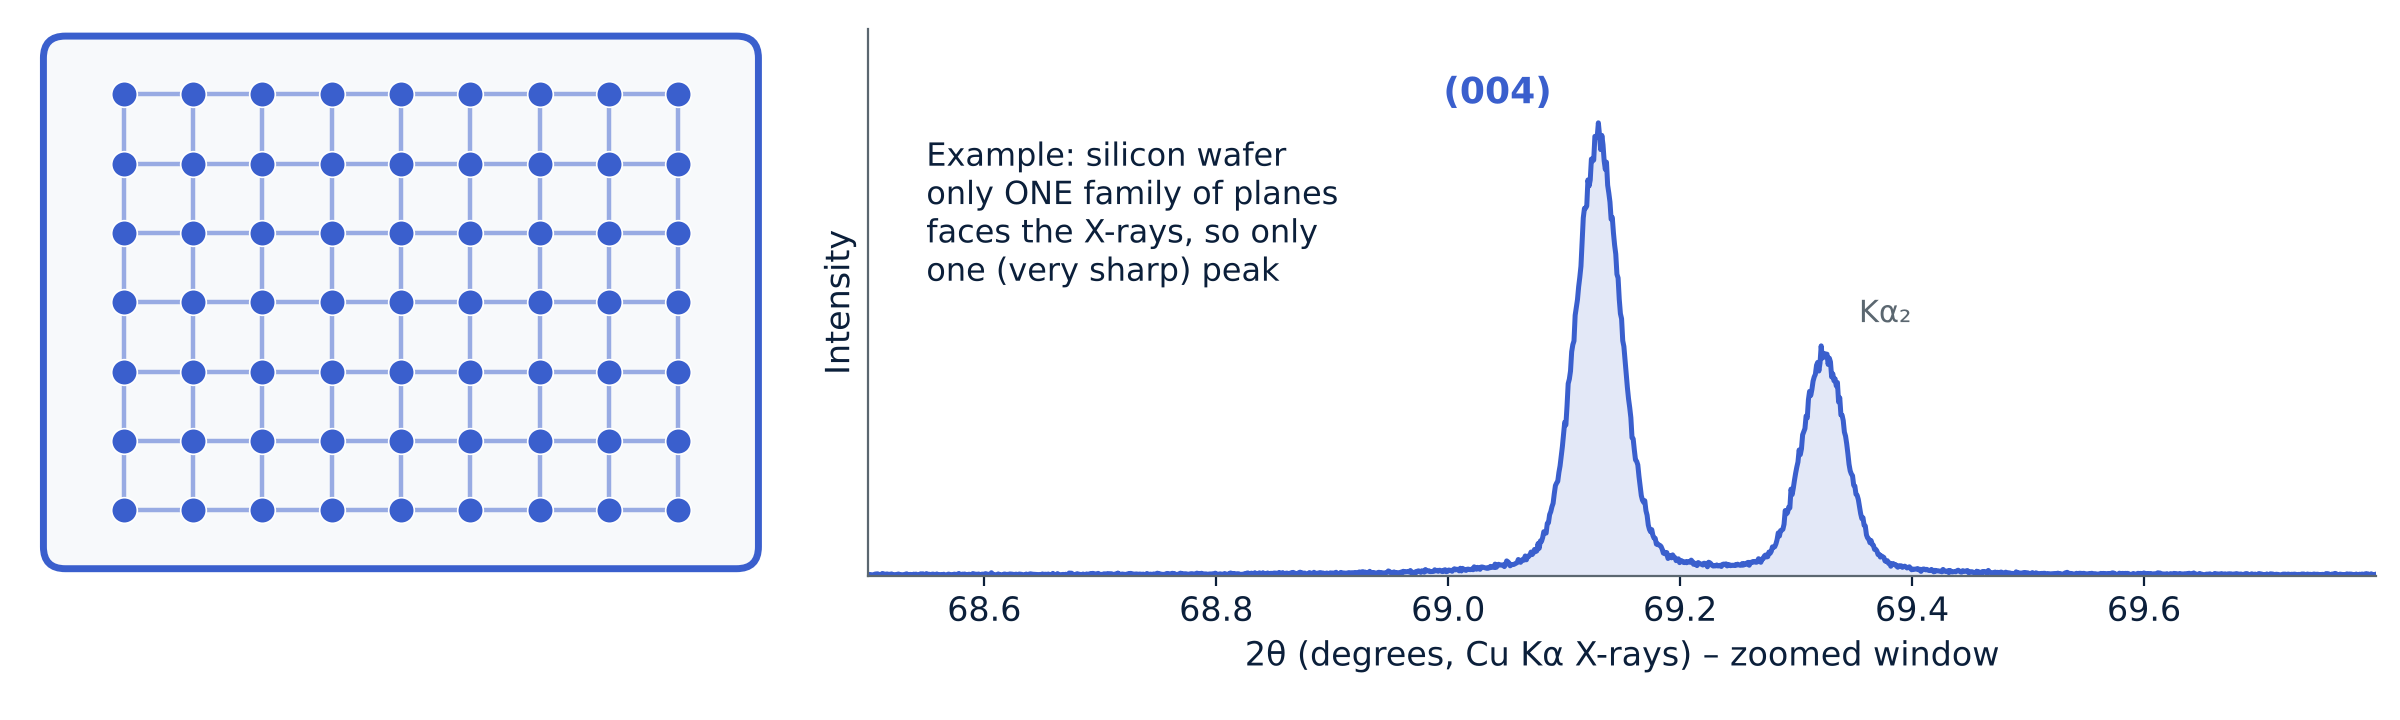
A symmetric θ–2θ scan of a single-crystal wafer selects lattice planes parallel to the surface. Cubic Si (100), equivalently indexed as Si (001), can show the allowed {400} reflection near 69.1° with Cu Kα radiation. Other geometries access other reflections. Peak position and width can inform strain and structural quality, but instrumental resolution, rocking curves and reciprocal-space maps must be considered.
- What you see: one or a few very sharp peaks (or spots).
- What you use it for: checking orientation, quality and strain of crystals and wafers.
Phosphors
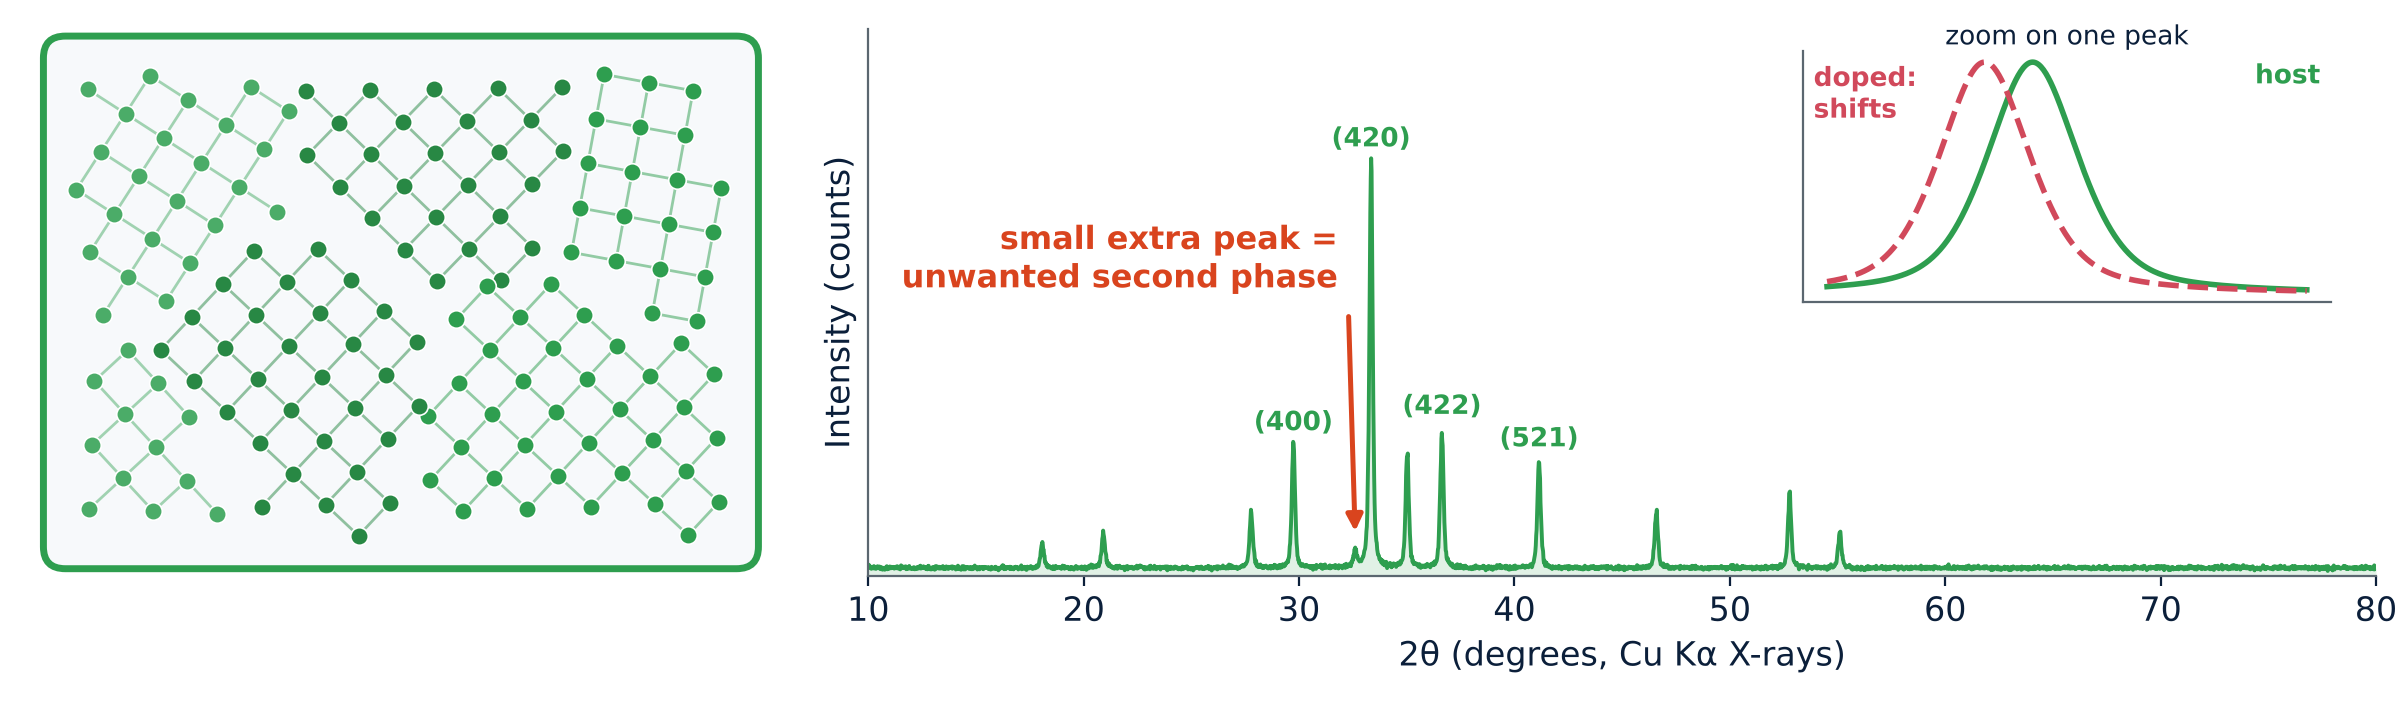
Phosphors often contain a crystalline host with a small amount of luminescent dopant. XRD checks the host structure and looks for detectable secondary phases. Substitution can change lattice parameters and shift peaks, but a small shift alone does not prove dopant incorporation. Reference matching, calibrated peak positions and complementary composition measurements strengthen the assignment.
- What you see: many sharp peaks that can be compared with a reference card.
- What you use it for: phase purity and tracking how doping changes the lattice.
Ceramics
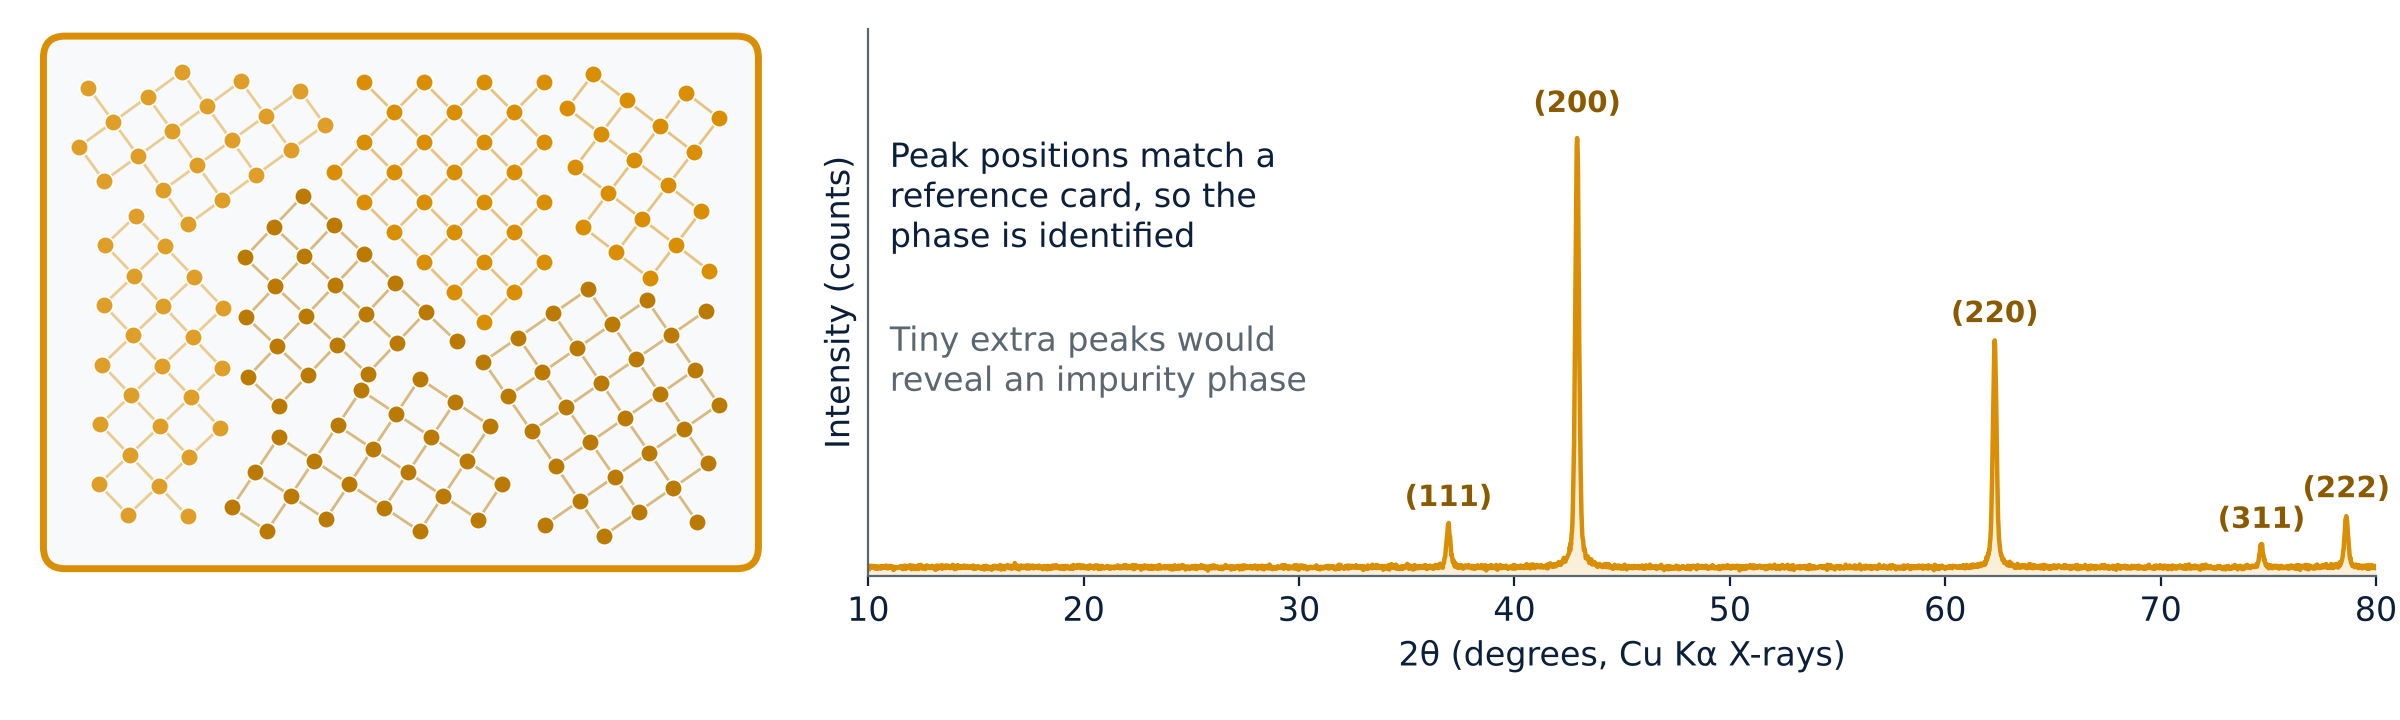
Crystalline ceramic grains produce characteristic diffraction peaks. Comparing a full pattern with reference data helps identify the phases present. Additional peaks may reveal secondary phases, subject to overlap and detection limits. Quantitative phase fractions require an appropriate whole-pattern or calibrated method; peak heights alone are insufficient.
- What you see: sharp peaks at fixed positions.
- What you use it for: identifying phases, spotting impurities and measuring lattice size precisely.
Metals
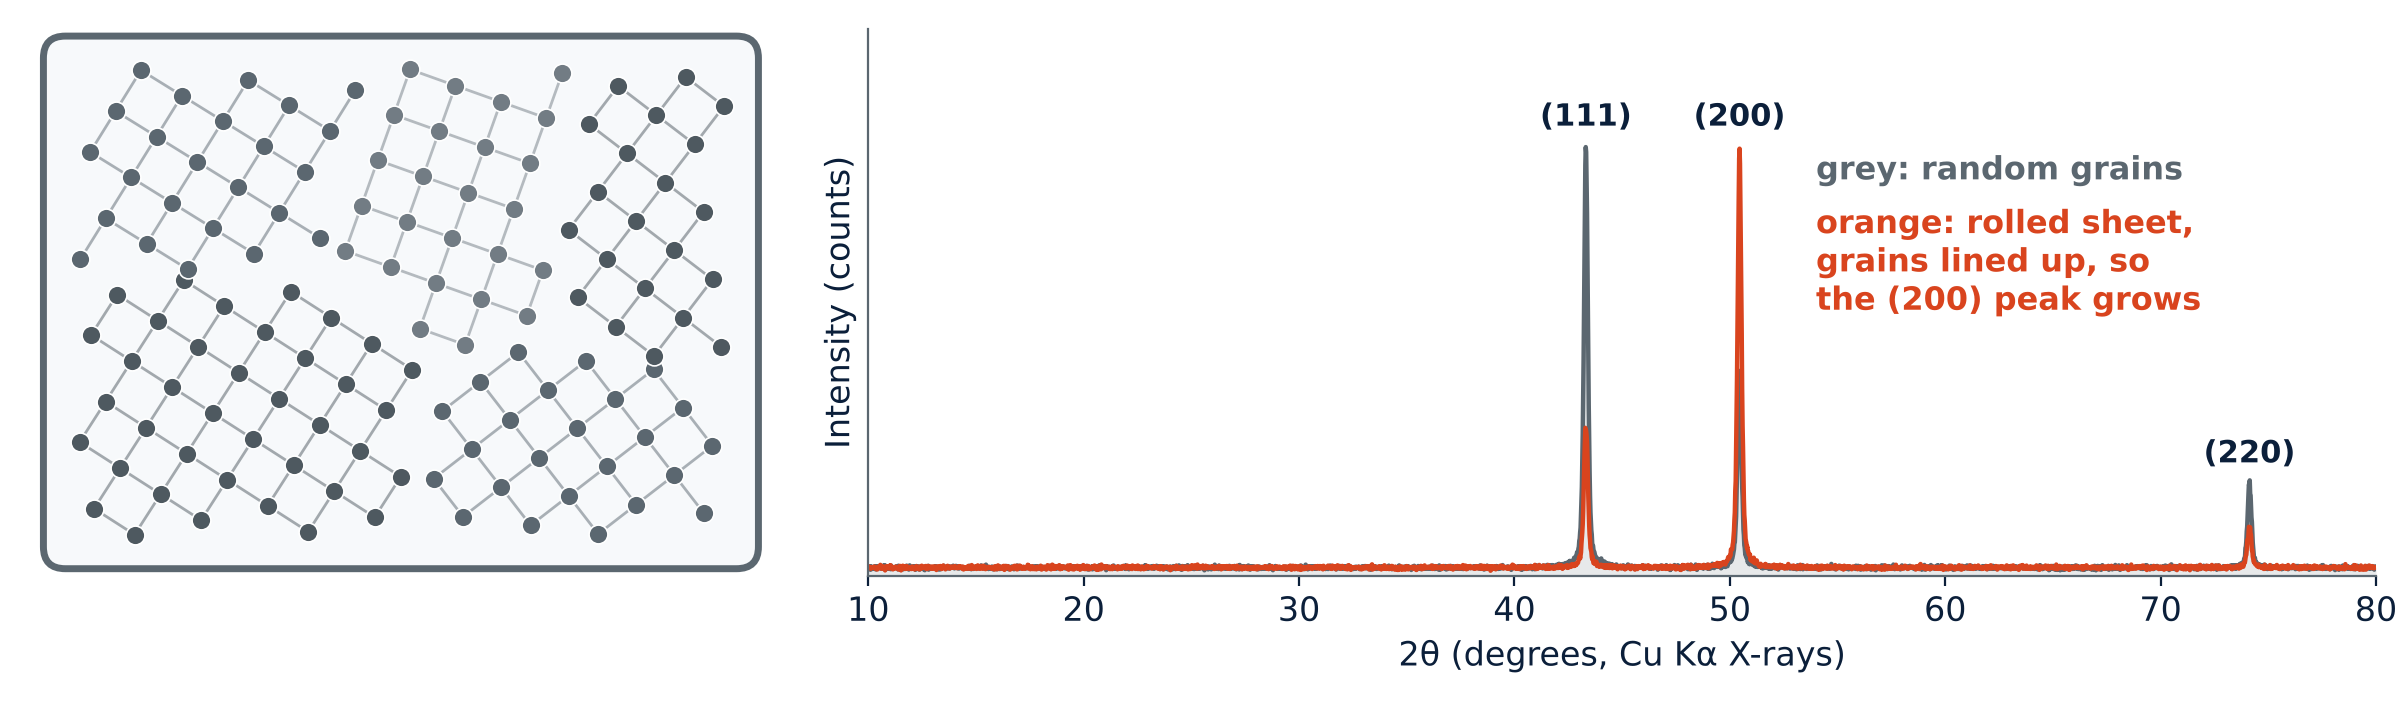
Metals are polycrystals, so their pattern looks like a powder pattern. Copper has a face-centred cubic lattice with peaks near 43.3°, 50.4° and 74.1°. If the grains are lined up, for example by rolling a sheet, the relative peak heights change (here the (200) peak grows and (111) shrinks). Processing strain shifts and broadens peaks.
- What you see: a few sharp peaks whose positions are set by the lattice.
- What you use it for: lattice size, grain orientation (texture) and strain from rolling or heat treatment.
Nanomaterials
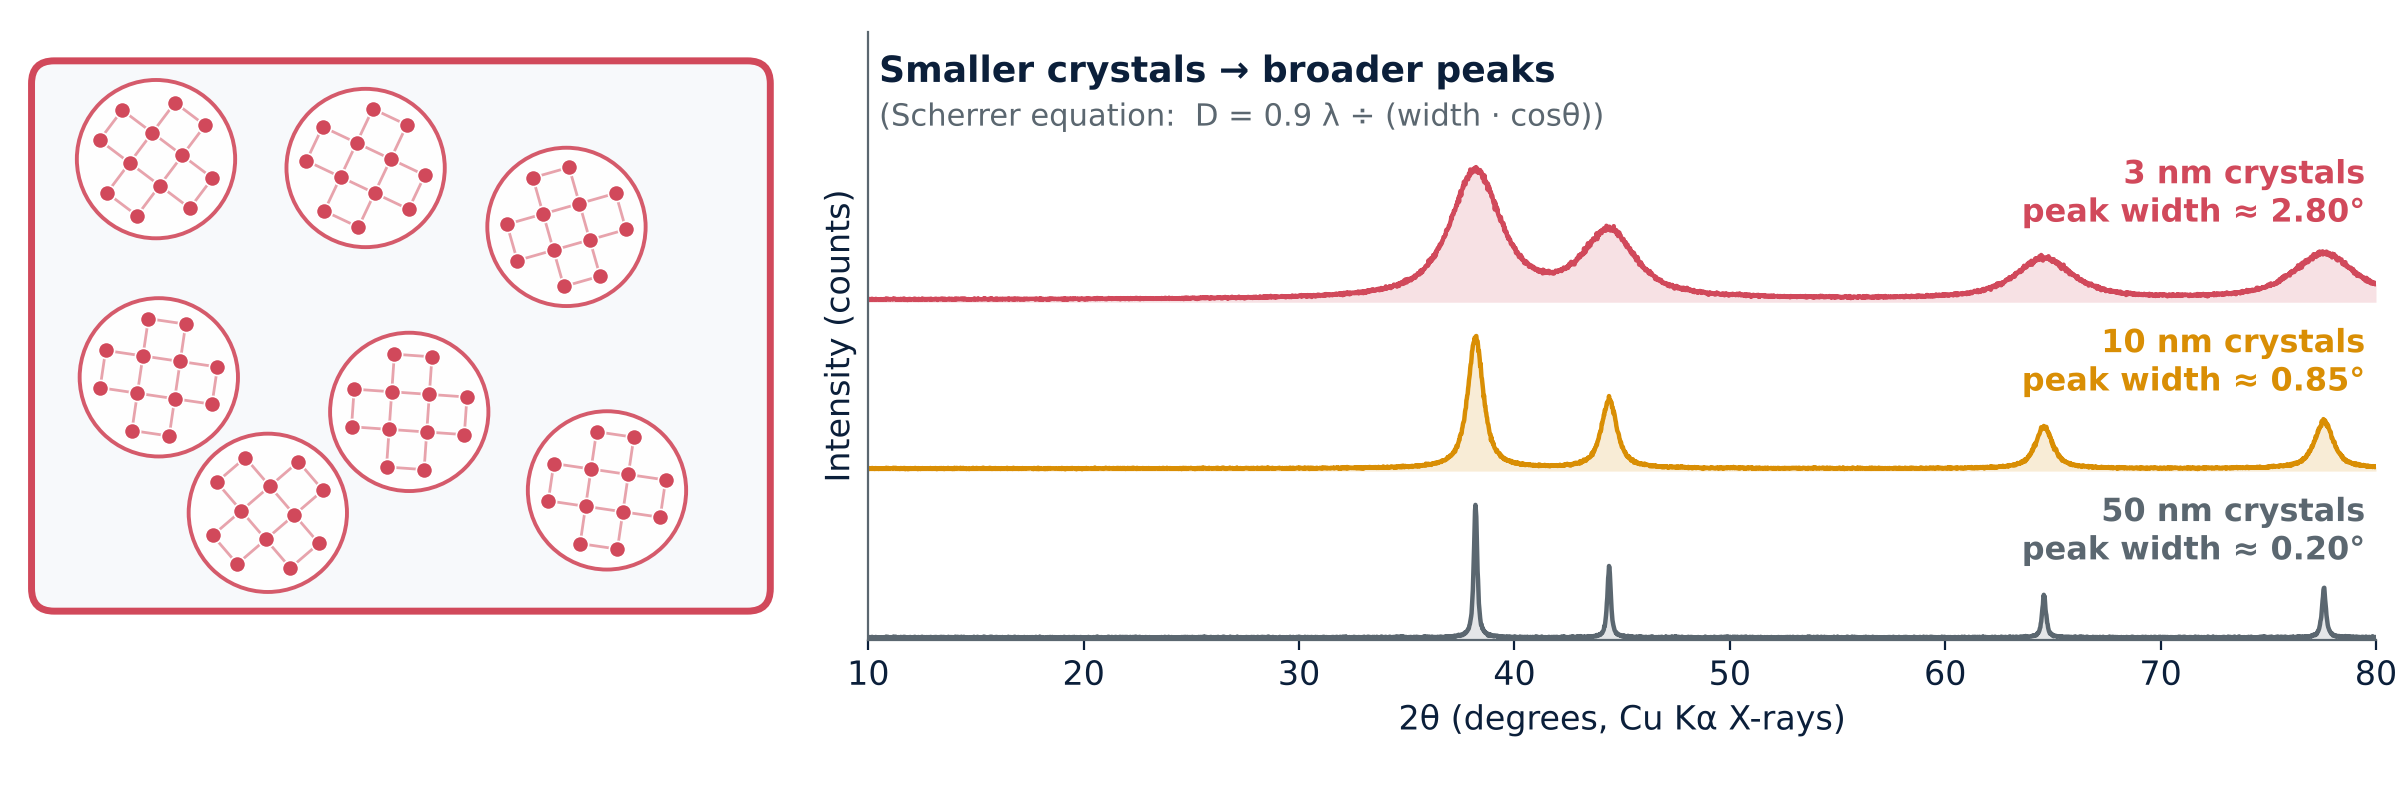
A smaller coherent diffracting domain gives broader diffraction peaks. The Scherrer equation estimates the domain size perpendicular to the diffracting planes when size broadening can be separated from instrumental and strain effects:
D = K λ ÷ (β cosθ), with K ≈ 0.9 for this example
Here β is the sample size-broadening FWHM in radians of 2θ, after instrumental correction, and θ is half the peak position 2θ. At the Au (111) peak near 38.2° with λ = 1.54 Å and K = 0.9, ideal size-only FWHM values are about 0.17°, 0.84° and 2.8° for domains of 50, 10 and 3 nm. The plotted curves are illustrative and may include additional width. Crystallite size is not necessarily particle size; strain, defects and instrumental resolution can also broaden peaks.
- What you see: the same peak positions as the bulk material, but much broader.
- What you use it for: estimating coherent domain size and following growth, with suitable instrumental and strain corrections.
Glass-ceramics
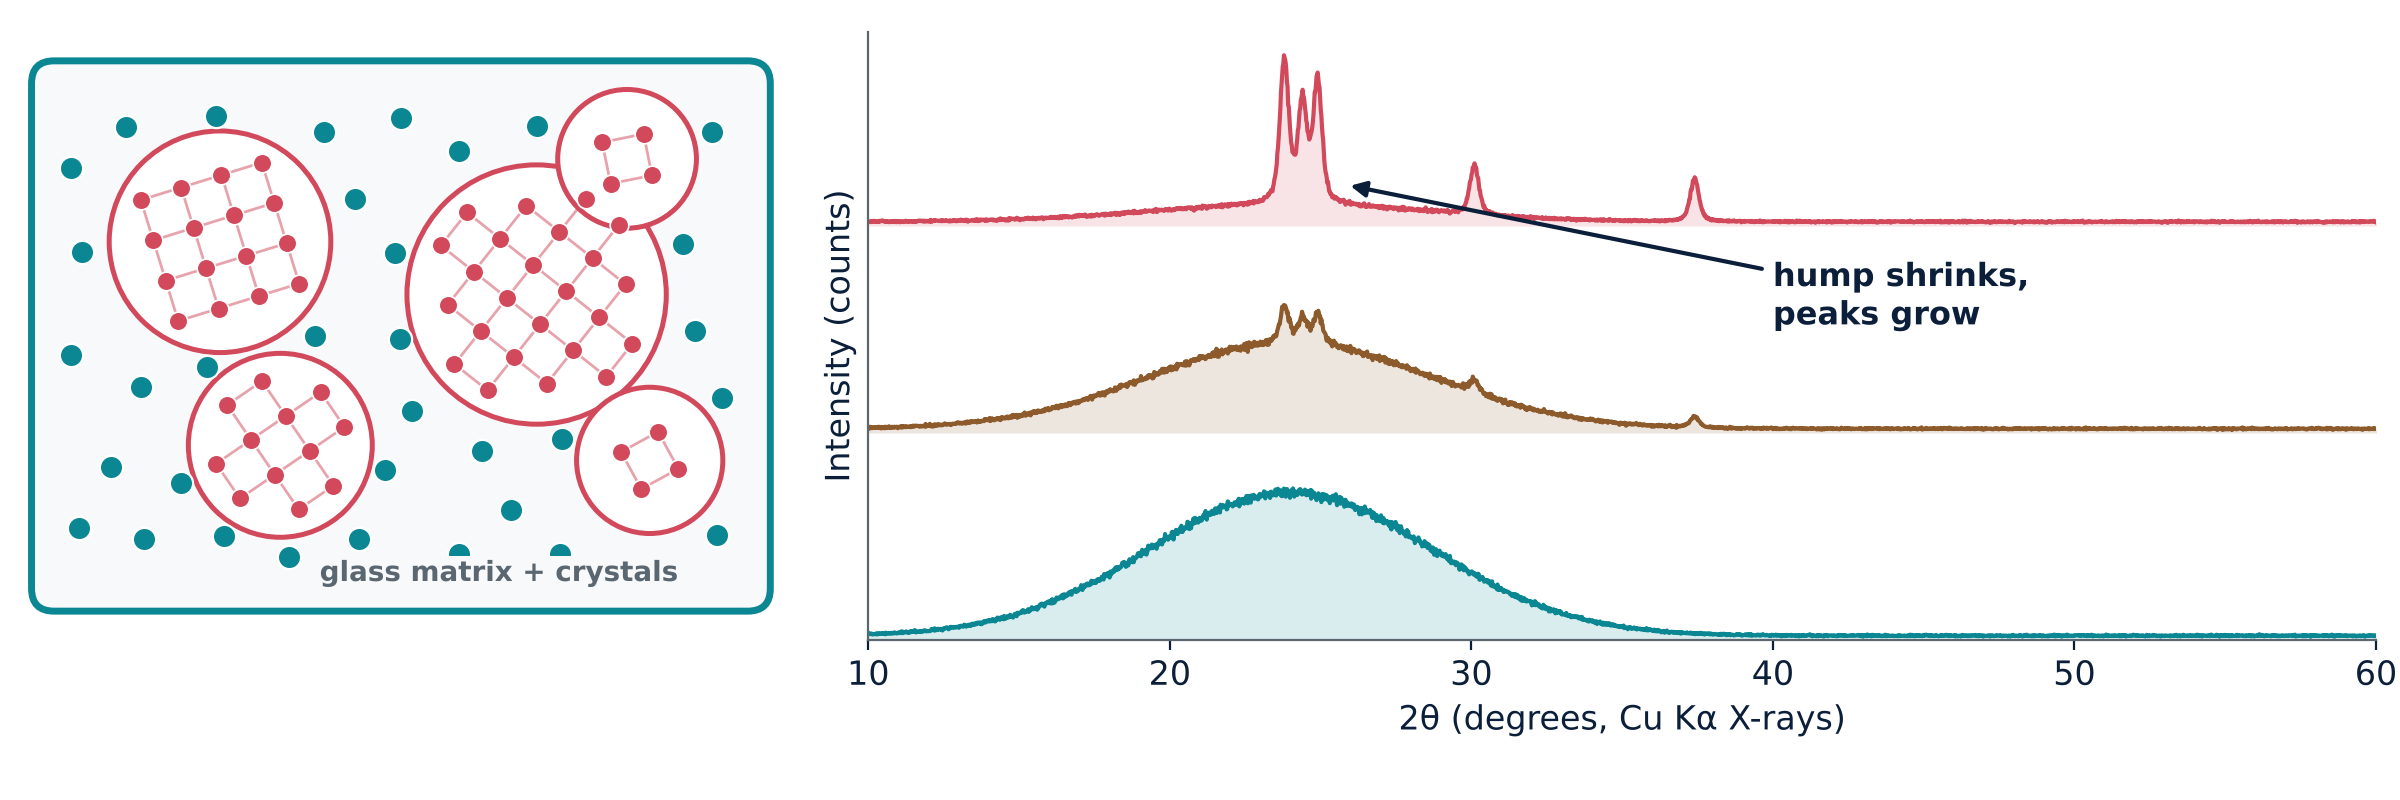
A glass-ceramic contains crystals within a residual glassy matrix. Its pattern can combine Bragg peaks with diffuse scattering. Changes during heat treatment track crystallisation and phase formation. Quantitative crystal-to-glass fractions require suitable calibration or a quantitative refinement method; peak height or hump size alone is insufficient. The illustrated peak positions represent a lithium-disilicate-type phase.
- What you see: peaks sitting on a leftover hump.
- What you use it for: following crystallisation and checking which crystals formed.
All together
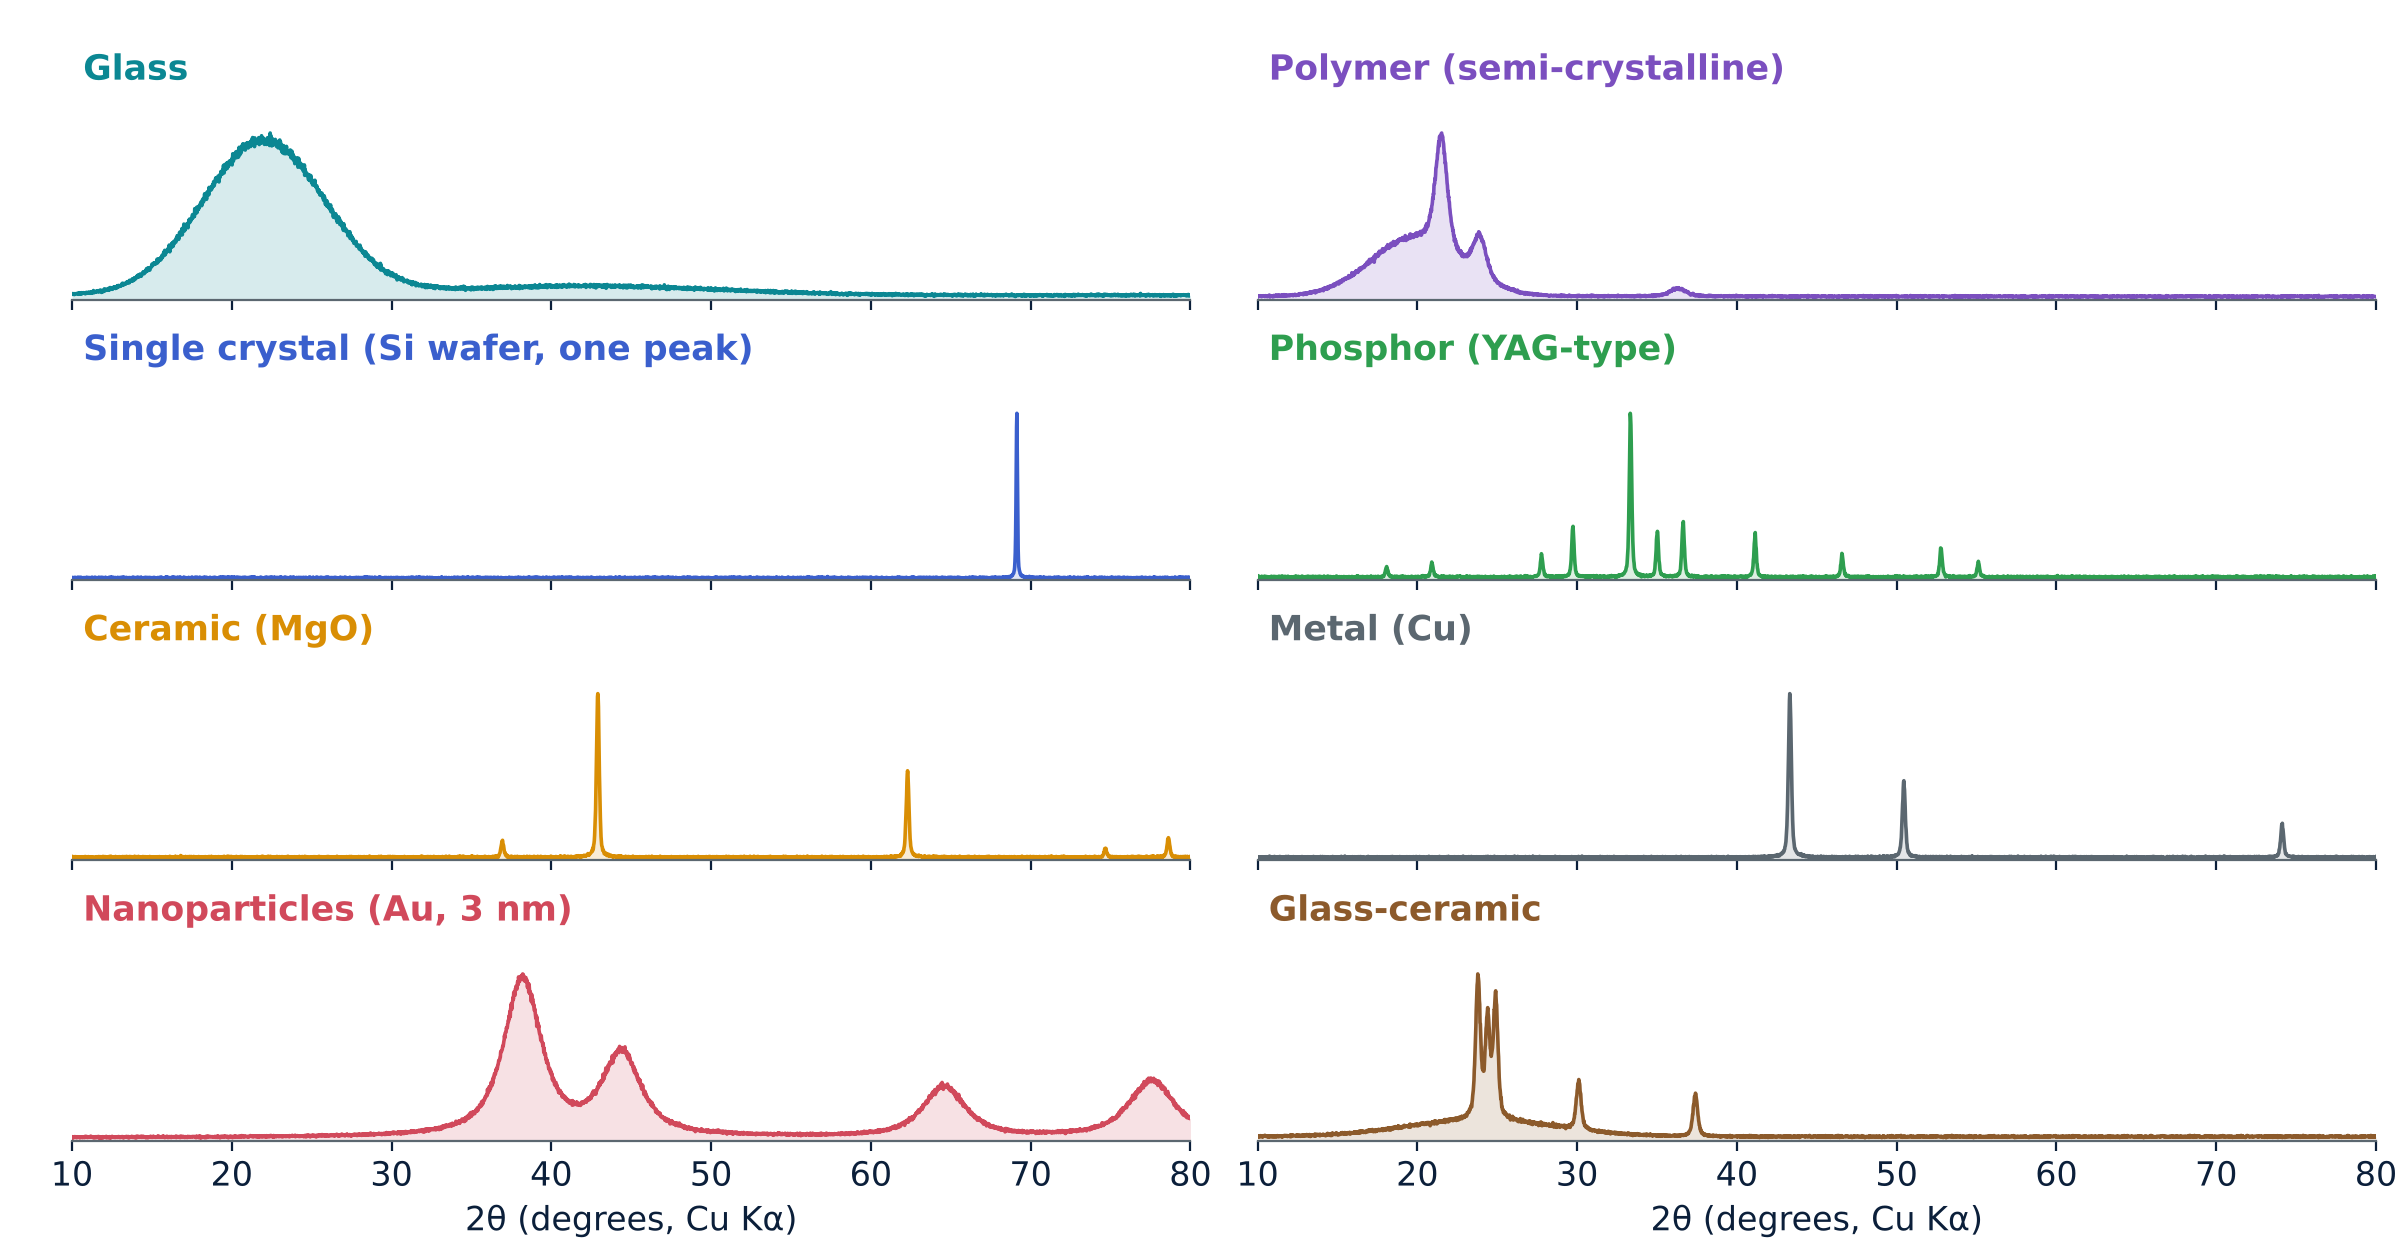
| Material | Pattern | What XRD tells you |
|---|---|---|
| Glass | One broad hump | Predominantly amorphous character; local order needs further analysis |
| Polymer | Peaks on a hump | Percentage crystallinity |
| Single crystal | One or a few very sharp peaks | Orientation, crystal quality |
| Phosphor | Many sharp peaks | Right phase, purity, effect of doping |
| Ceramic | Sharp peaks | Phases present, impurities, lattice size |
| Metal | Few sharp peaks | Lattice size, texture, strain |
| Nanomaterial | Broad peaks | Coherent domain size (corrected Scherrer estimate) |
| Glass-ceramic | Peaks plus hump | Crystal-to-glass ratio, crystal phase |
What XRD cannot tell you easily
- Small amounts can be missed: the detection limit depends on phase, matrix, crystallinity, peak overlap, instrument and acquisition conditions; there is no single universal percentage.
- Light atoms: hydrogen, lithium and similar atoms scatter X-rays very weakly.
- Preferred orientation: plate-like or needle-like grains can distort peak heights.
- Sample height error: a misplaced surface shifts every peak.
- Overlapping peaks: different phases or broad peaks can mask each other.
- The illuminated volume is averaged: a conventional laboratory scan reports contributions from the sampled material rather than one selected particle. For glasses and liquids, total-scattering pair-distribution-function analysis, NMR or Raman can add structural information.
Takeaways
- Bragg's law links peak angle to the spacing between atomic planes.
- Sharp peaks mean order; a broad hump means disorder.
- Broader peaks can indicate smaller coherent domains, but strain and instrumental broadening must also be evaluated.
- Peak positions fingerprint the crystal phase.
View the XRD presentation · 18 slides
Explore Bragg’s law, instrument geometry, pattern interpretation and eight families of materials.
XRD Calculators
Calculate interplanar spacing, diffraction angle, X-ray wavelength and crystallinity from integrated XRD areas.
Open XRD calculators ↗